
Supplementary Material of 'FRIDA: A Multilevel Digital Atlas for the Ephemeral Renaissance, La Serenissima Venice, 1450–1550'
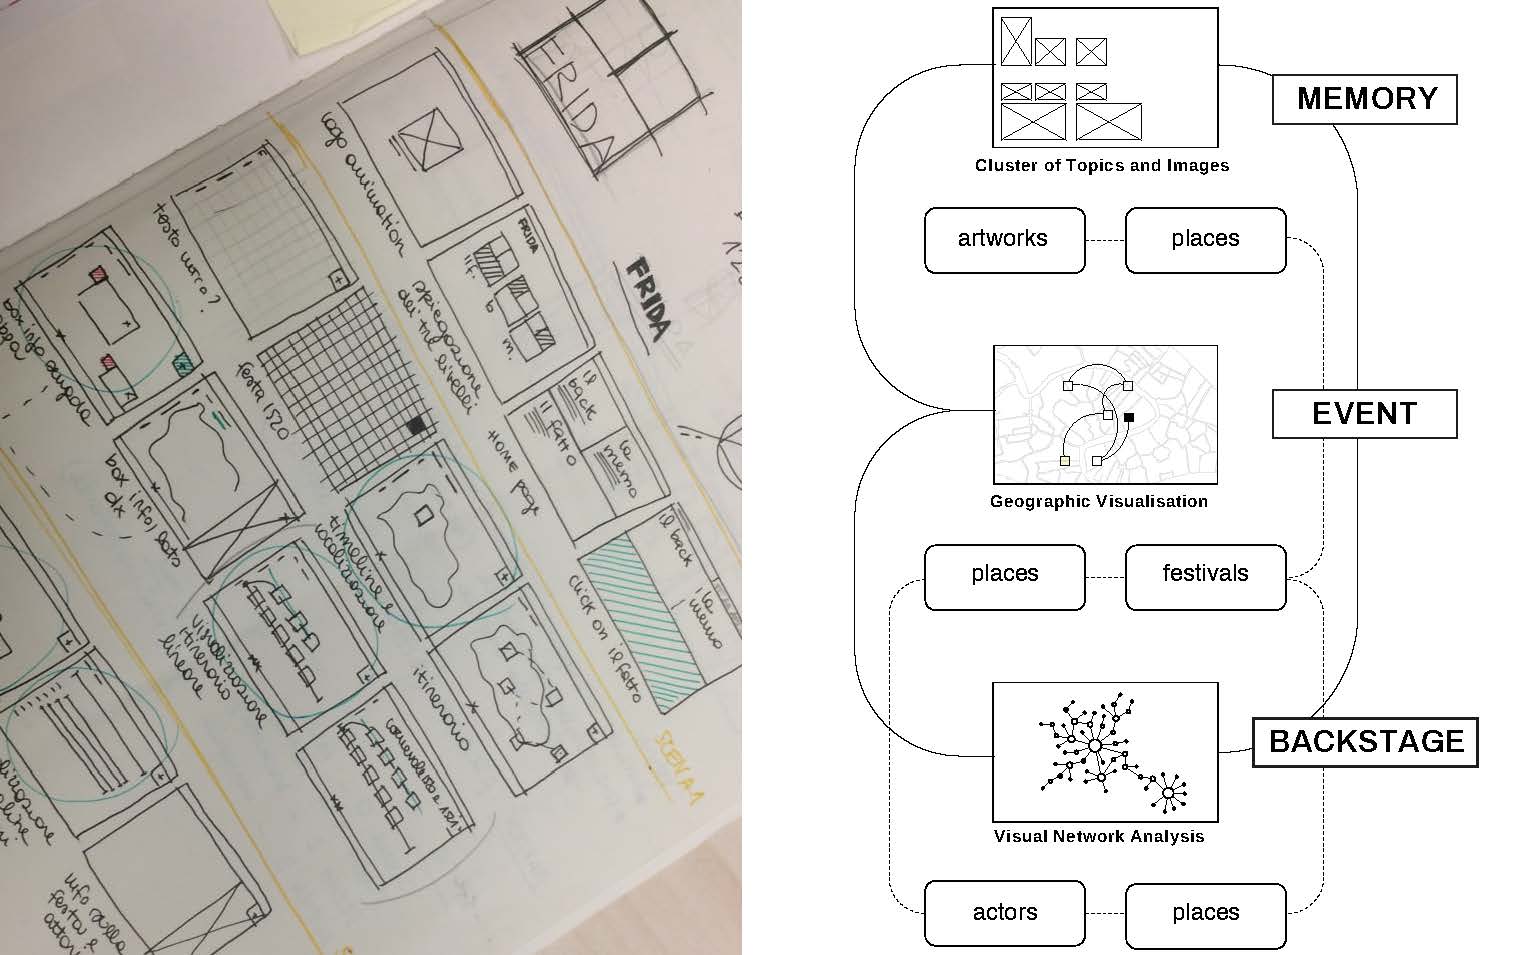
Figure 1. FRIDA is divided into three fully interactive sections: Event, Backstage, and Memory.
Figure 2. (1) Cartographic visualizations of the festivals’ itineraries, recreating the multimediality of the “Event”; (2) Social…
Listed in Image | publication by group Iter Community
Version 2.0 - published on 27 Jul 2026 doi:10.25547/05Z9-SC19 - cite this
Licensed under Creative Commons BY-NC 4.0





Description
Figure 1. FRIDA is divided into three fully interactive sections: Event, Backstage, and Memory.
Figure 2. (1) Cartographic visualizations of the festivals’ itineraries, recreating the multimediality of the “Event”; (2) Social network diagrams of social/political/performative communities, retracing the “Backstage” of the festivals; (3) Clusters of texts and images, restoring the “Memory” of the festive event.
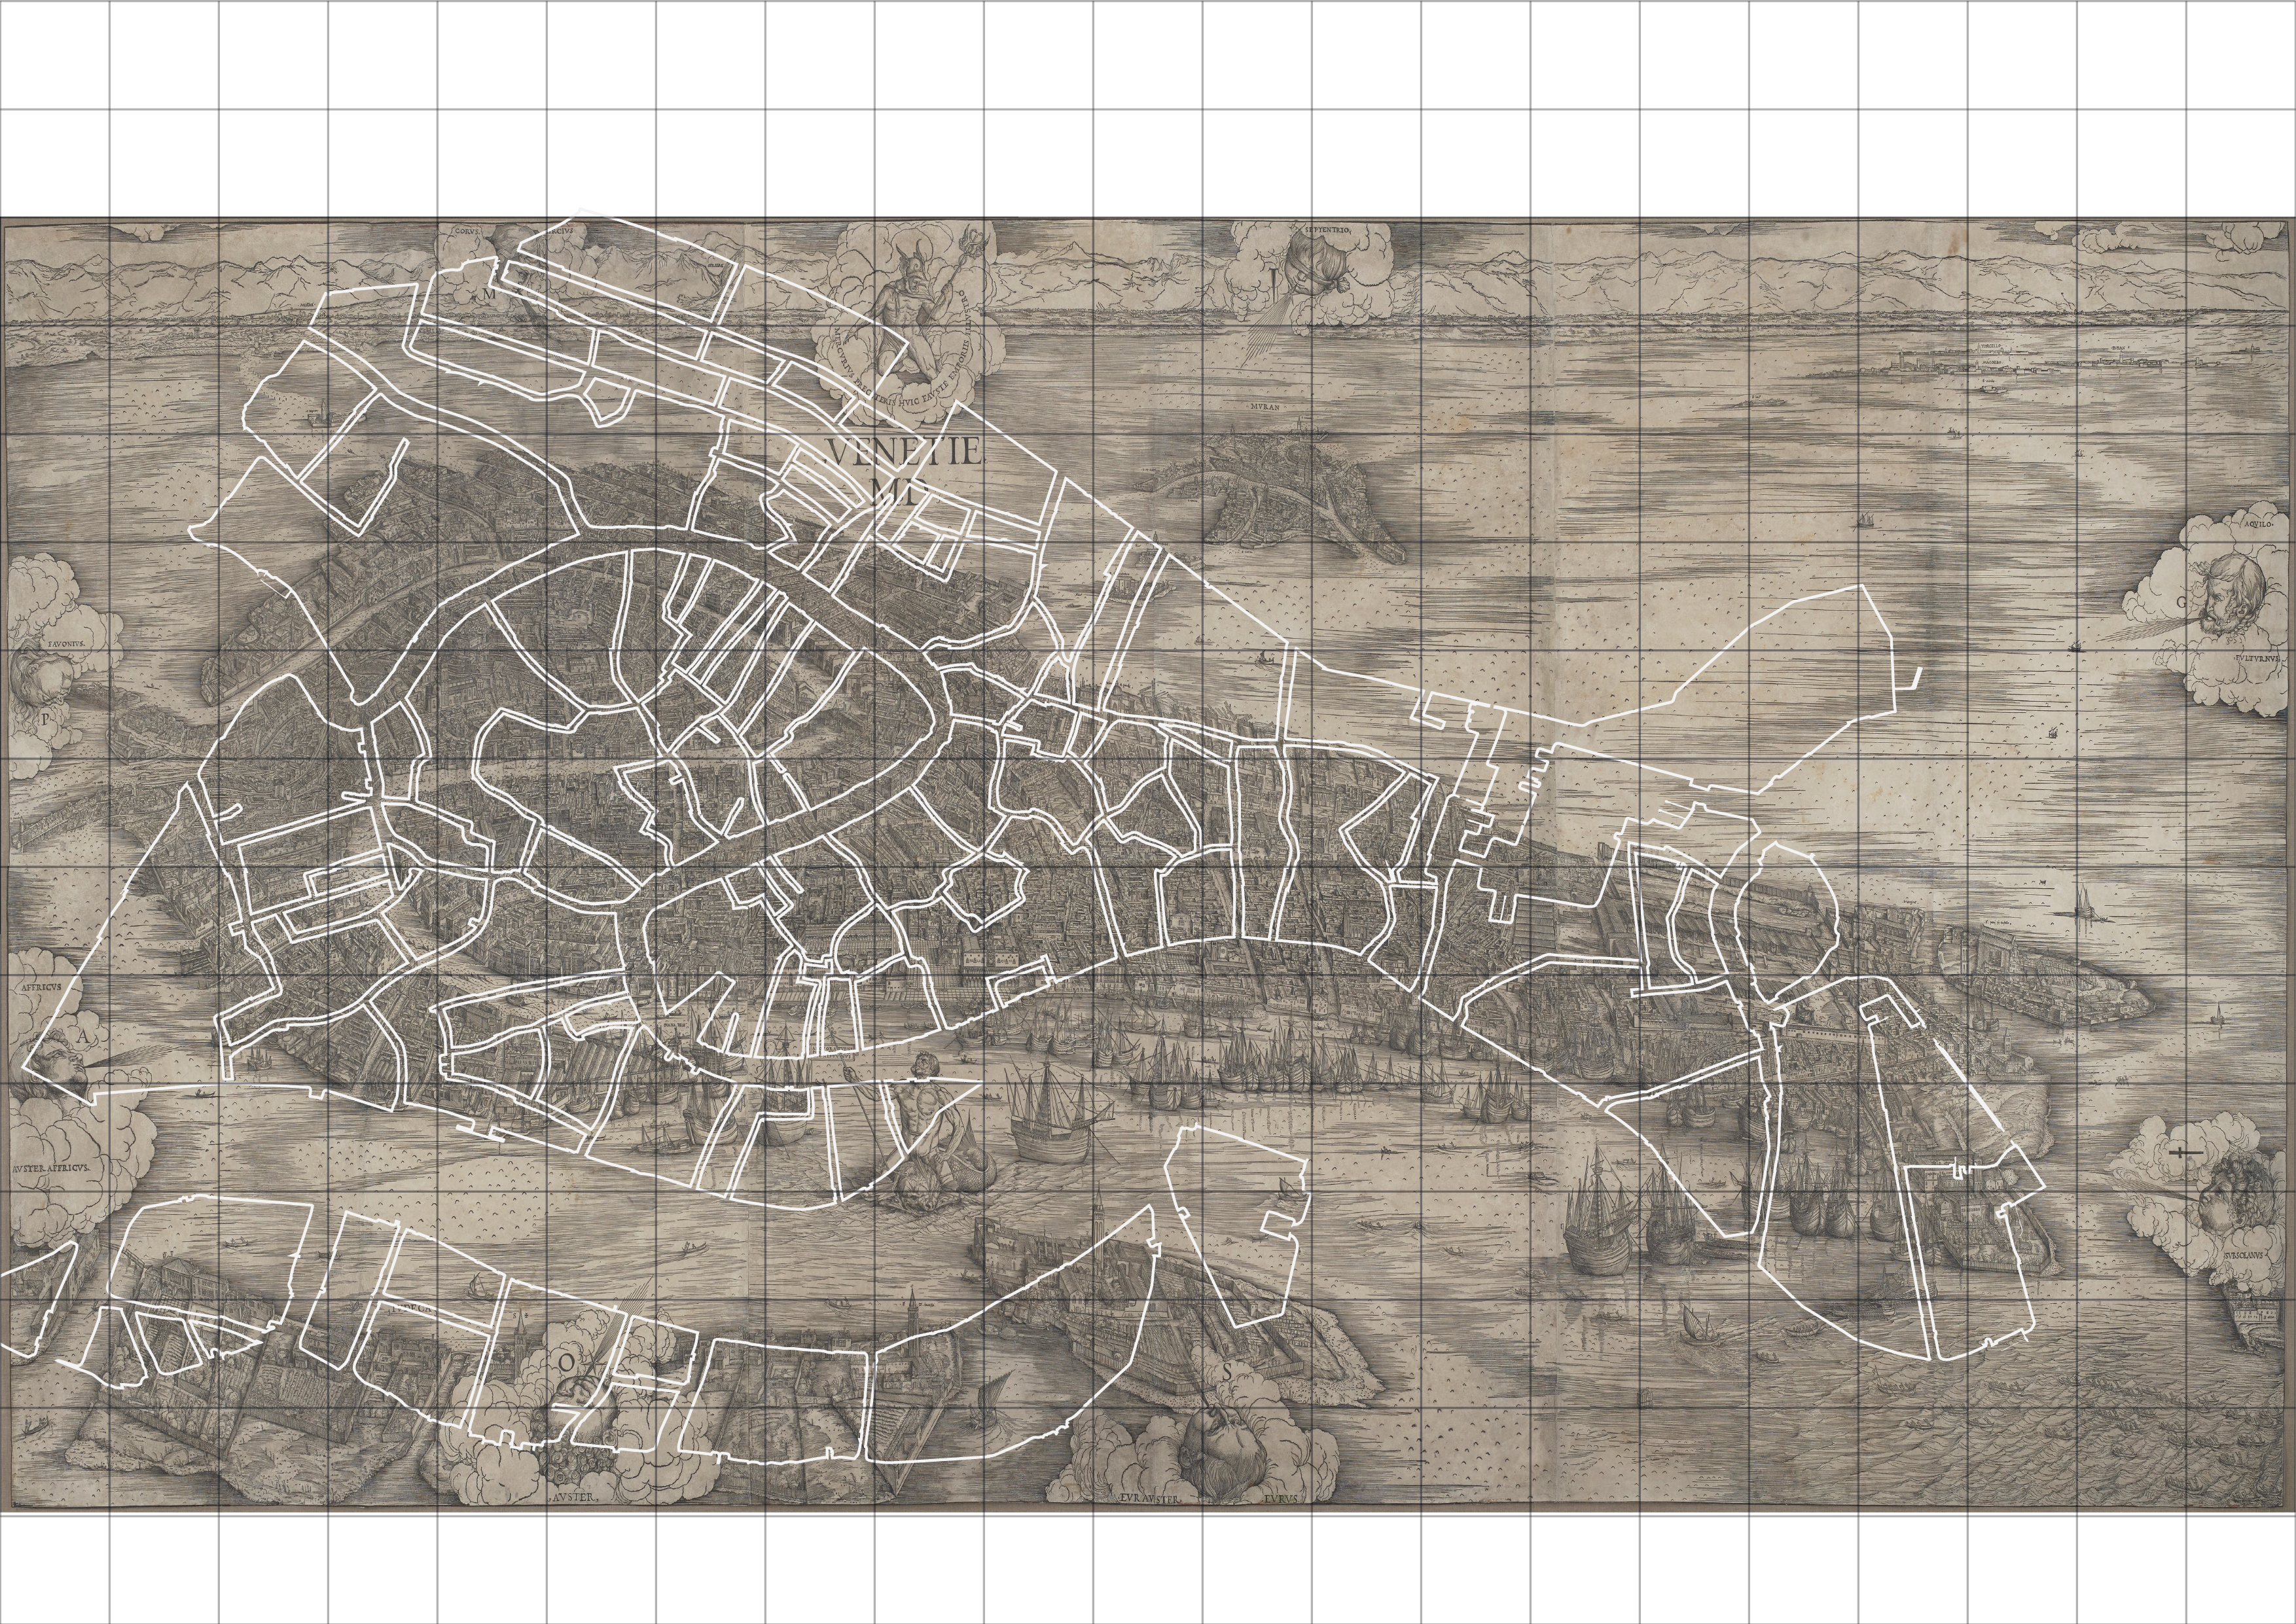
Figure 3. We overlapped a current geographical map with the historical Jacopo de’ Barbari’s View of Venice (1500).
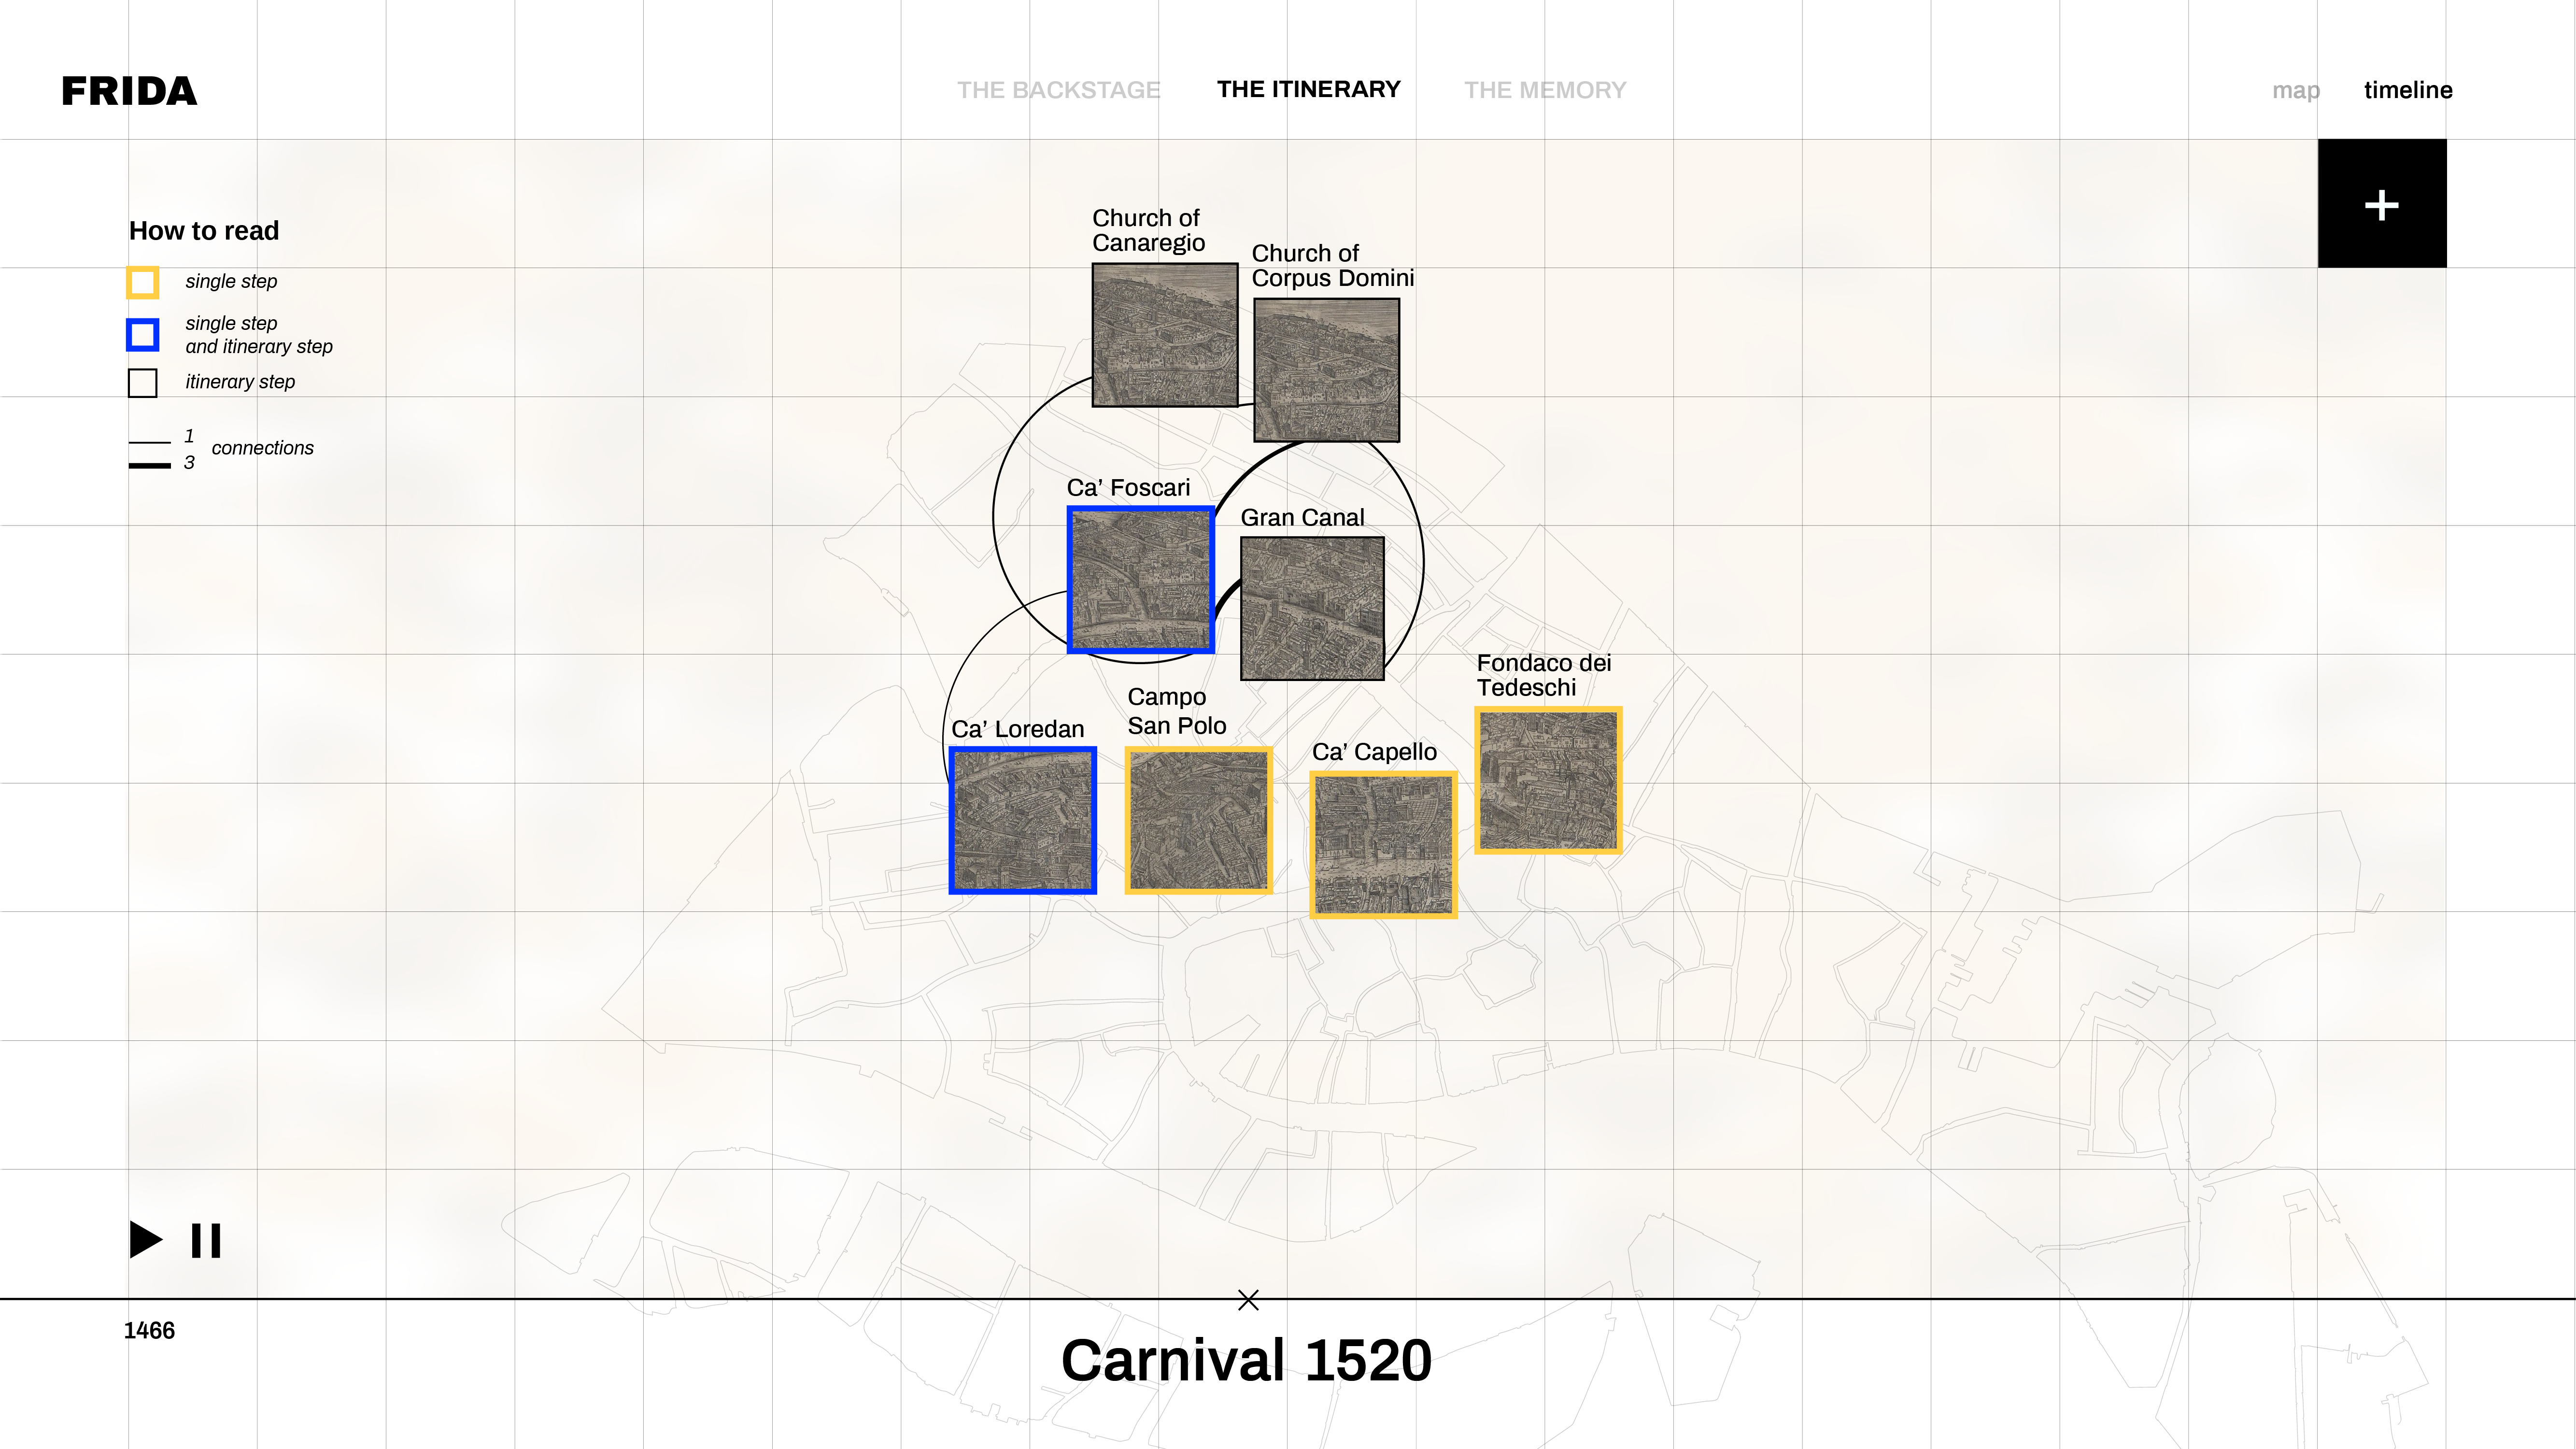
Figures 4–5. An animation describes the movement of the festival participants between locations of importance, creating a virtual itinerary by using icons from de’ Barbari’s View of Venice that highlighted the most important stages and venues (Fig. 4). Users can see the chronology of a particular Event in a timeline format (Fig. 5). See also Video 1 on the companion website.
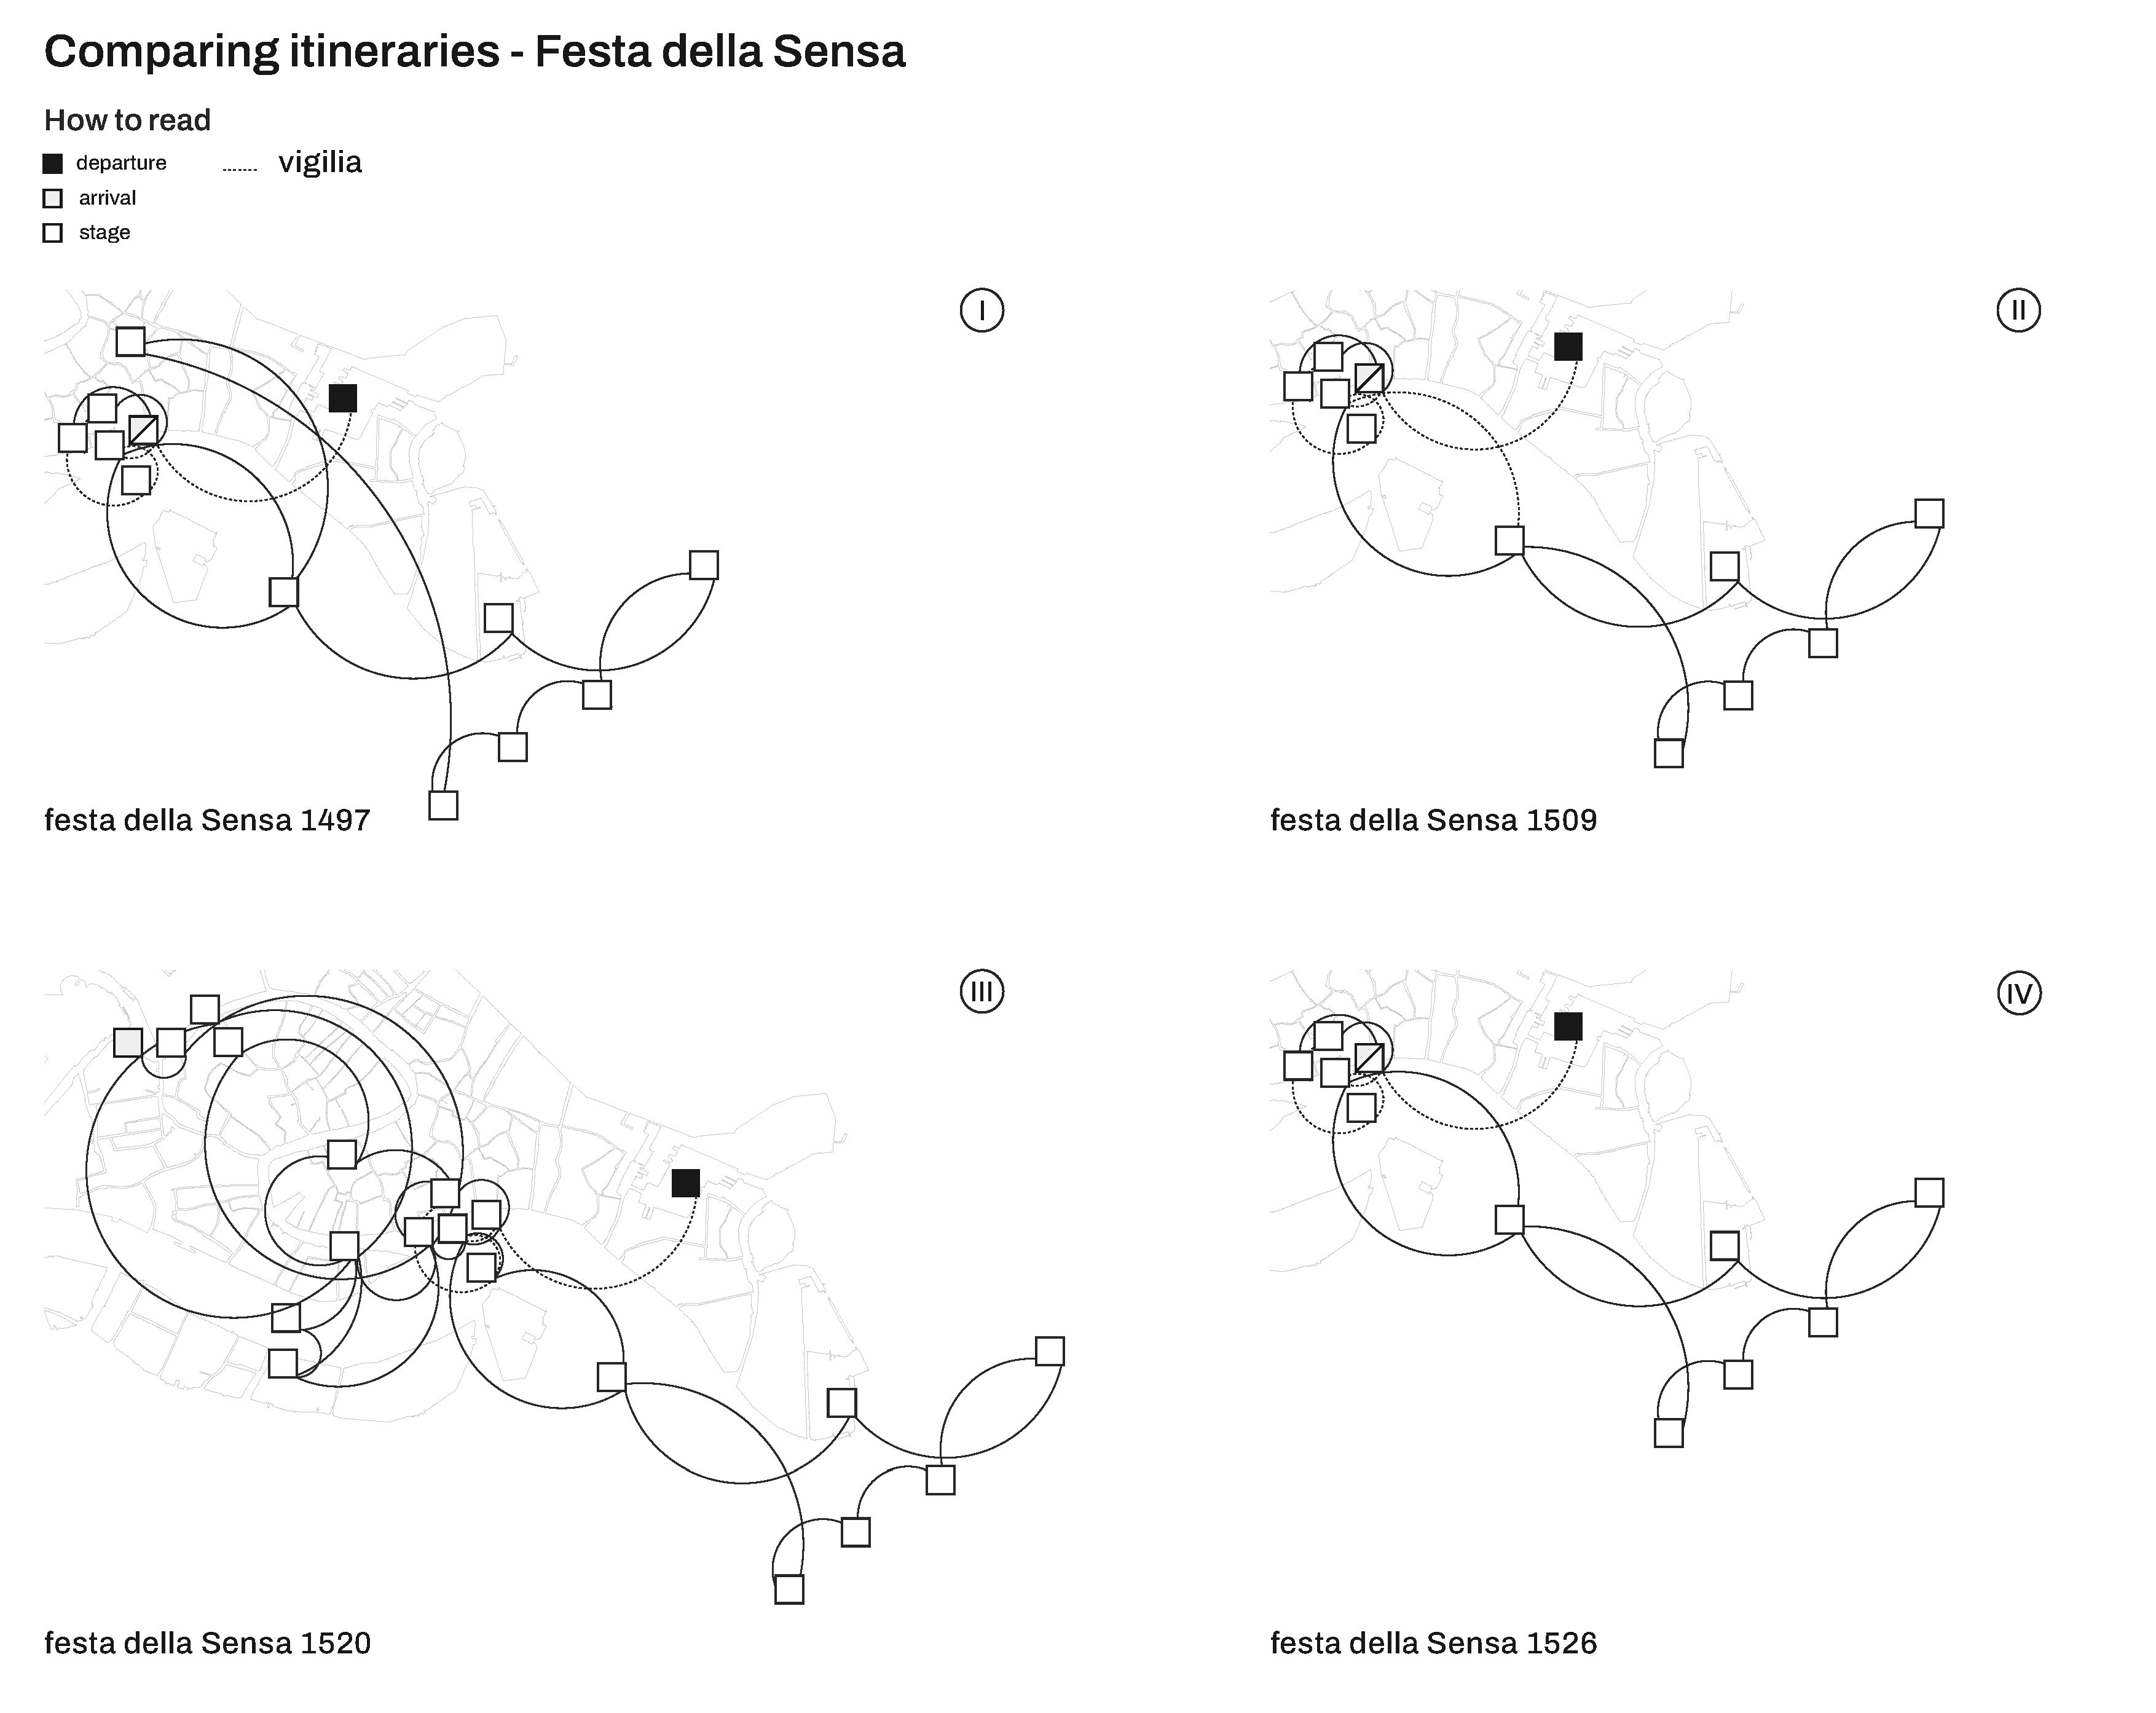
Figures 6–7. The timeline format arranges the festival diagrammatically and allows for comparisons between locations, events, and itineraries of different festivals (Fig. 6). The system offers the possibility of visualizing data for multiple itineraries, which can be also visualized in the map itinerary (Fig. 7). In this case, the representation of four itineraries shows elements of variability of the canonical ritual of the Festa della Sensa, reconstructing four different temporal moments. Political facts or social strategies modified traditional itineraries and use of the urban space. See also Video 2 on the companion website.
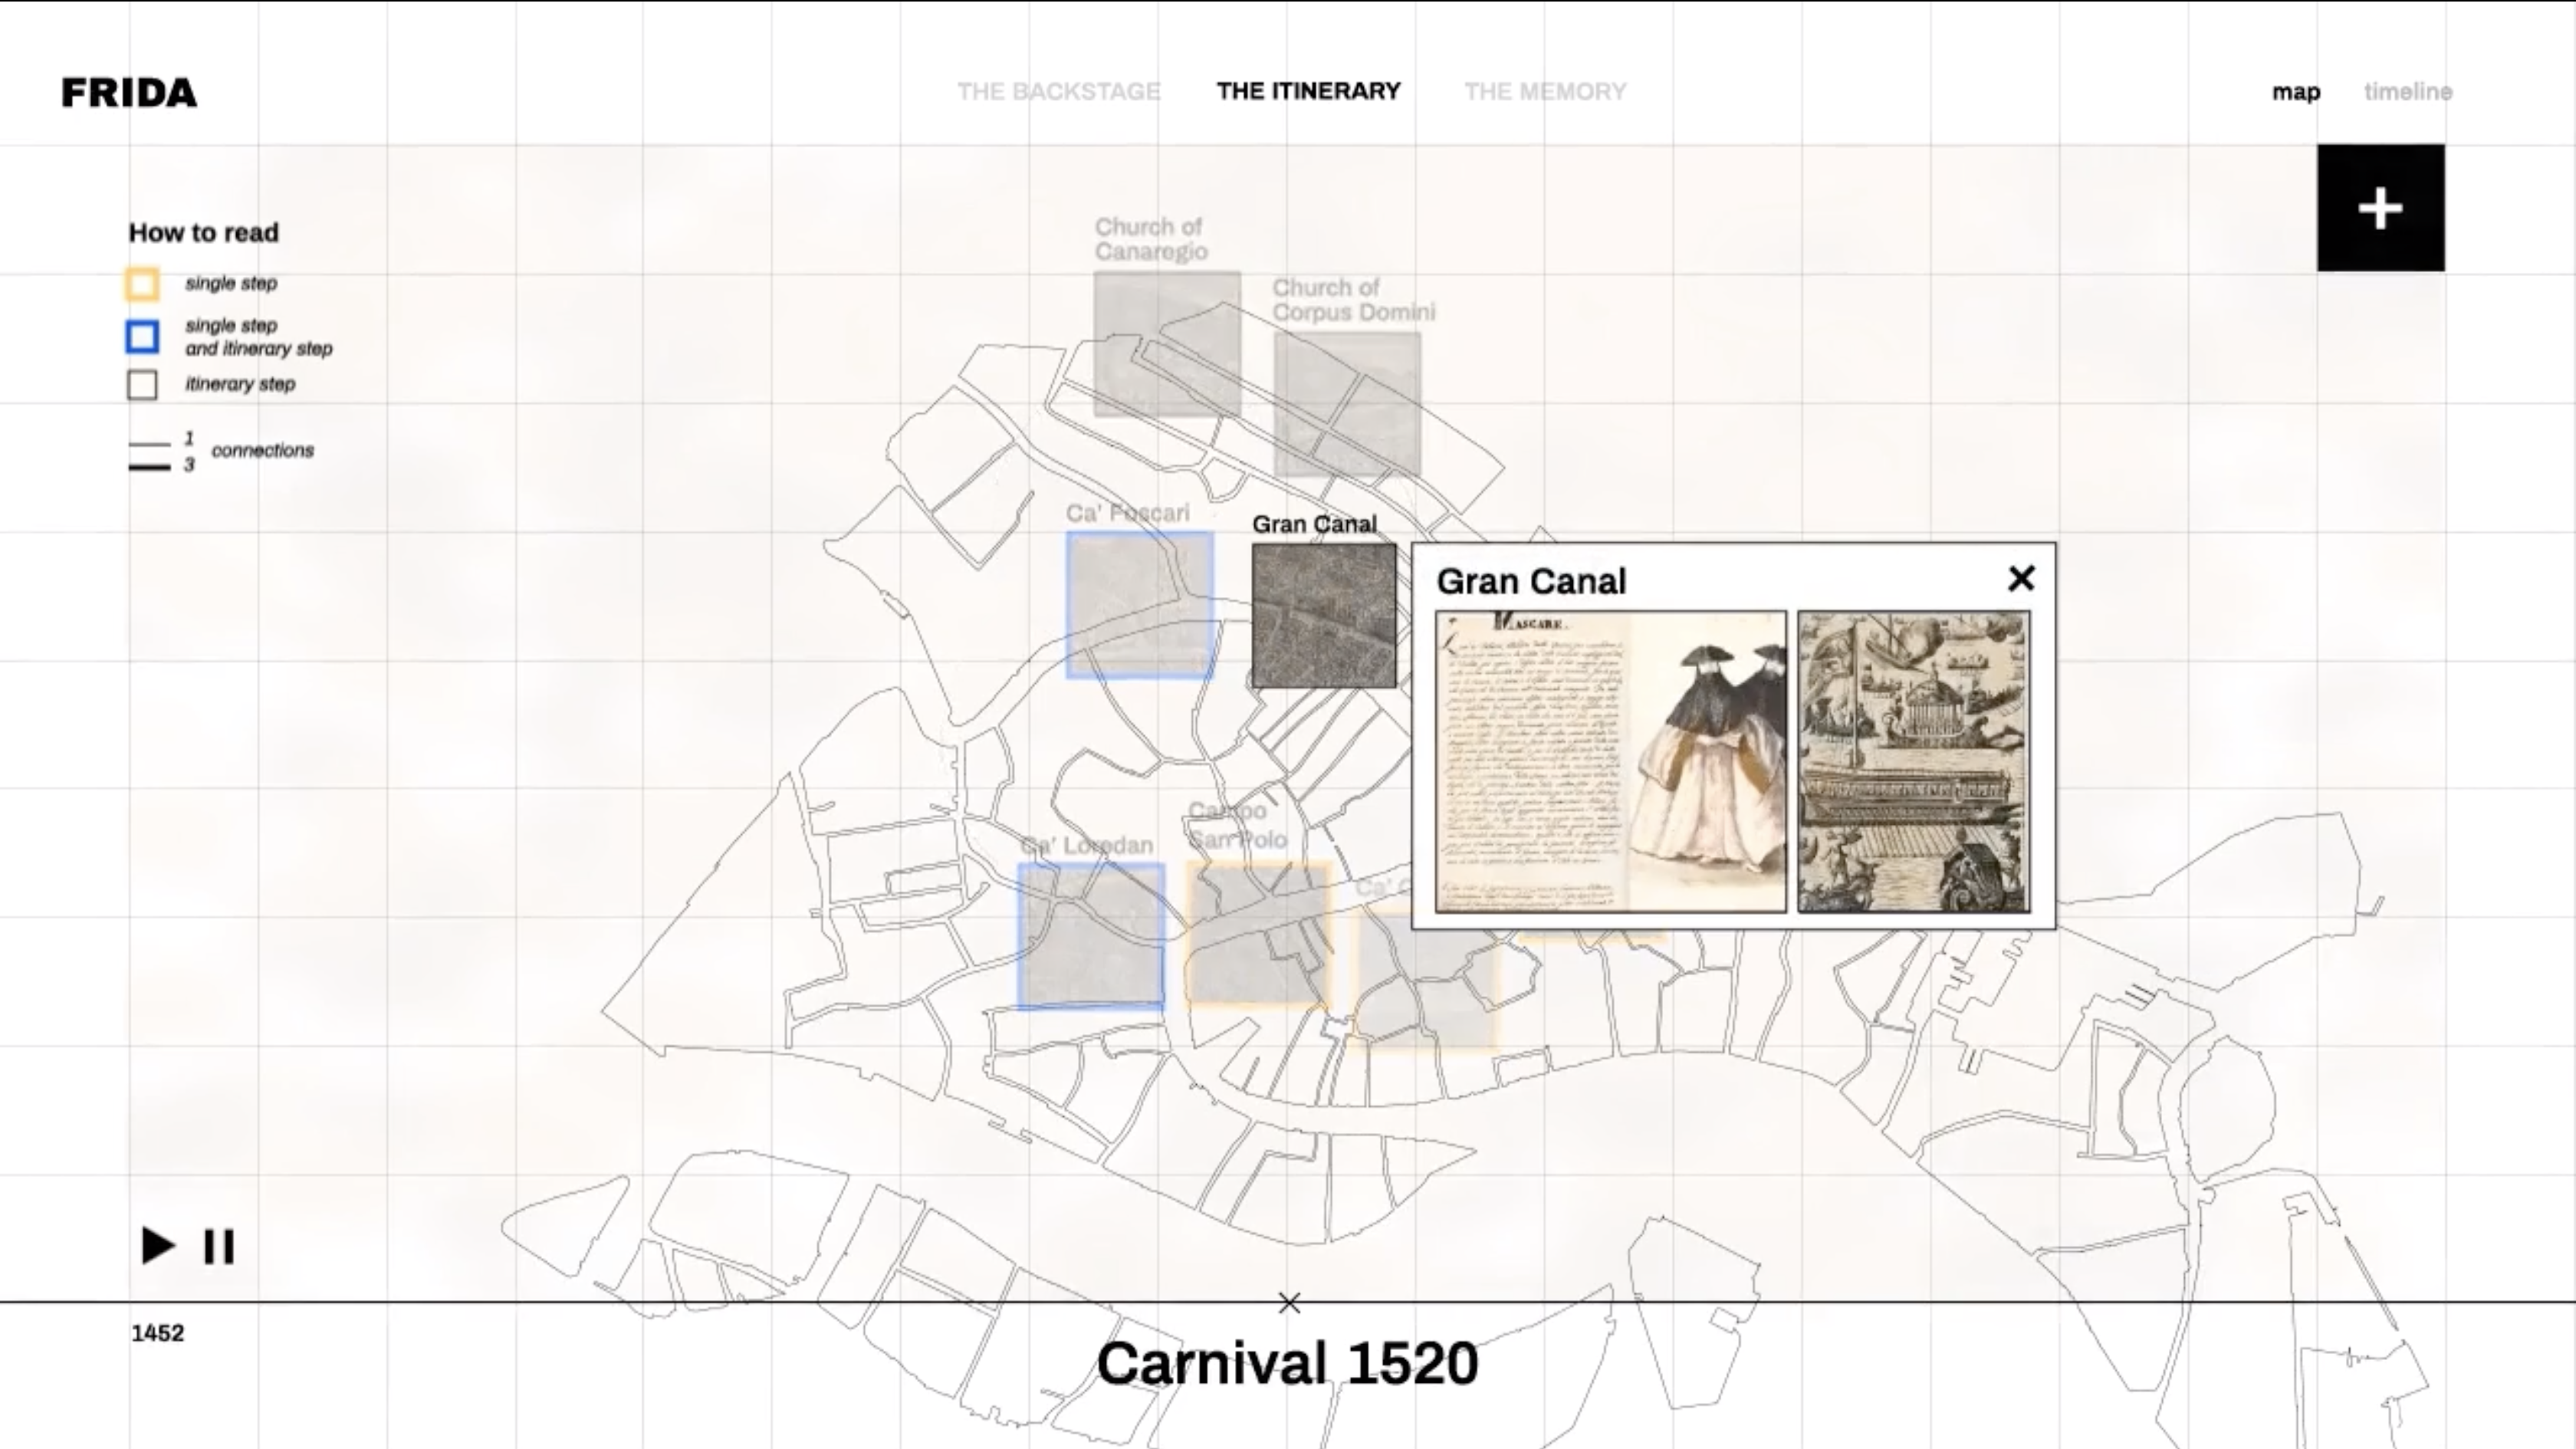
Figures 8–10. Additional information including visual and textual materials that are collected in the Atlas can be easily accessed by clicking each of the de’ Barbari icons (Figs. 8–10). Here is a description of Carnival 1520 from the fifteenth-century manuscript of the Diarii by the historien Marin Sanudo and a transcription of the document (Fig. 8). Users will be able to access other historical accounts, chronicles, letters, and literary works related to the event as well as visual material (Fig. 9), maps, and music works (Fig. 10). We are now working on the integration of music registration.
Figures 11–15. A georeferenced network shows the relation between (private and public) spaces and types of ceremonies, entertainment, and performances (Figs. 11–12). The bars show the number of occurrences for each type of festive event; the themes that composed the visual, musical, and poetical program of the festive events; and the group and individuals who participated in different ways at different events (actors) (Figs. 13–15).
Figures 16–17. An animation of network views describes a vibrant microcommunity of the actors (social subjects, performers, and patrons). In particular, for the Carnival and the Festa della Sensa in 1520, we compared and connected the social network of the actors active during these two events with other festive occasions, specifically over the governors of Venice, Loredan, and Gritti (Fig. 16). The user can identify a single actor and visualize his/her own activity/role in different events through a series of visual diagrams and dynamic network views, which will make visible a web of relationships and circuits of people, knowledge, and actions that are not always perceptible in an overview (Fig. 17). This investigation will reveal an increasing number of interconnections as we increase the number of festivals analyzed, and will also reveal hidden connections between individuals, communities, spaces, and types of the ceremonials that composed the festive program. See also Video 3 on the companion website.
Figures 18–19. The network diagrams identify the corpus of festivals based on the typology of events. In this case, the visual diagrams describe the theme of the Trojan cycle, relating the network of actors who contributed to four festivals (in 1502, 1515, 1520, and 1524) that used the Trojan myth as a dramaturgical core of the mythological staging (Fig. 18.1). It is possible to identify a single actor or group of actors and visualize their role in the selected events and investigate the connections between actors, themes, genre, and models (Fig. 18.2–4).
Figures 20–22. Additional information about contributors (Fig. 20) and specific festival events (Figs. 21– 22) can be viewed by the user. Information includes short biographies, transcriptions of documents, and a selection of multimedia material. Information may also be viewed in a timeline format. This provides a chronological reference of both festivals and contributors. See also Video 4 on the companion site.
Figure 23. This visualization shows how the actor/places network has changed over time from 1450 to 1560. The visualization is composed of three views; each view focuses on a time frame of 50 years. The bar charts visualize the relation between the number of actors or places involved in the ceremonies of the selected intervals. In particular, the central time interval (1480–1530) is the most flourishing, indicating an increasing number of events and actors involved.
Figures 24–26. A hierarchically organized thesaurus includes a series of keywords, tags, and subcategories that will compose the model of the datasheet for each artefact and a related interlinked system of visual associations (Fig. 24). Each sheet includes a detailed description of fine art (Figs. 25–26), written accounts, poetry, and music related to a specific festival. See also Videos 5 and 6 on the companion website.
Figure 27. Correr Library, Venice, Ms Gradenigo Dolfin 49, sixteenth century.
Location in HSS Commons repository
Please see 'Notes' below for any suggested/official citation information added by the author(s) of this work. Otherwise, you can cite the HSS Commons instance of this publication as follows:
- Francesca Bortoletti, Giuseppe Gerbino, Paolo Ciuccarelli, Beatrice Gobbo, Tommaso Elli, (2026), "Supplementary Material of 'FRIDA: A Multilevel Digital Atlas for the Ephemeral Renaissance, La Serenissima Venice, 1450–1550'", HSSCommons: (DOI: 10.25547/05Z9-SC19)
Tags
Notes
Bortoletti, Francesca, et al. 2025. “FRIDA: A Multilevel Digital Atlas for the Ephemeral Renaissance, La Serenissima Venice, 1450–1550.” In New Technologies and Renaissance Studies IV: The Changing Shape of Digital Early Modern Studies, edited by Randa El Khatib and Caroline Winter, 149–96. New Technologies in Medieval and Renaissance Studies 12. Iter Press. https://iterpress.org/9781649591197/new-technologies-and-renaissance-studies-iv/.
Publication preview
Iter Community
This publication belongs to the Iter Community group.
When watching a publication, you will be notified when a new version is released.